Trading Charts Package for Flutter
market_chart
A free, open-source Flutter package for trading charts, with candlesticks, volume, indicators and live price updates.
- Built with
- Flutter
- Dart
- CustomPainter
- Gesture detection
- pub.dev
- Platforms
- Android, iOS, Web, Windows, macOS, Linux
- Year
- 2026
What it does
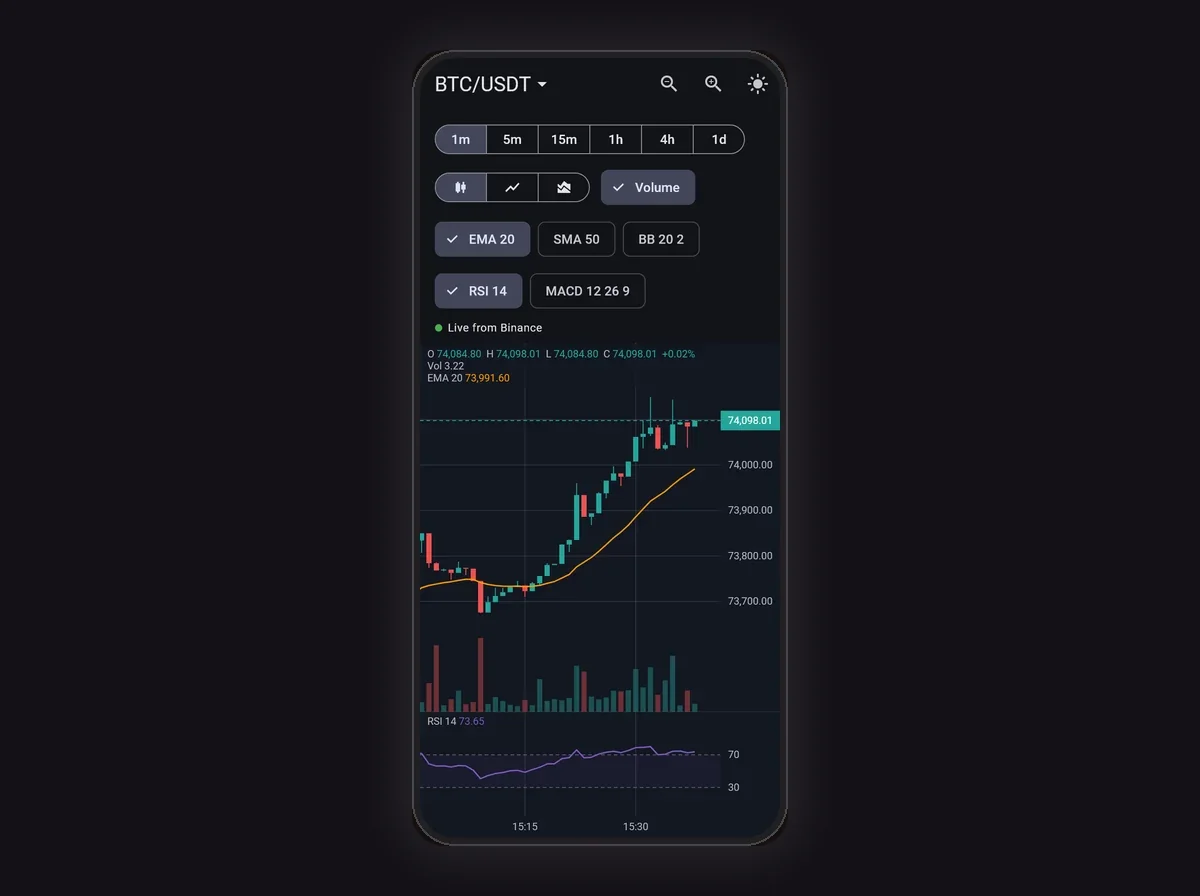
Candlestick, line and area charts with volume bars under the price.
Drag to scroll back in time; pinch, trackpad-pinch or mouse wheel to zoom.
A crosshair on long-press or hover that snaps to the nearest candle and shows open, high, low and close.
SMA, EMA and Bollinger Bands over the price, with RSI and MACD in panels of their own, checked against TA-Lib.
Live updates: CandleAggregator turns a stream of trades into candles of any length, and onLoadMore fetches older history as you scroll.
Light and dark themes with every colour adjustable, on Android, iOS, web and desktop, with no dependencies beyond Flutter.
Why I built it
I went looking for a gap on pub.dev that matched work I had already done. After building Pulse Market, a stock and crypto tracker, trading charts stood out: the strongest Flutter option is not open source and needs a licence, and the free packages were basic or no longer maintained.
How it’s built
The whole chart is drawn with a CustomPainter, with no chart library underneath. A price scale and a time scale turn candles into pixels; the time axis puts labels on round times (14:00, 14:15) and marks where days start, and prices get as many decimals as the market uses.
Indicators are plain Dart classes (SMA, EMA, Bollinger Bands, RSI and MACD) that can also be used on their own, for example for alerts. Their results were checked against TA-Lib, the reference library traders use.
The example app streams live BTC/USDT prices from Binance into the chart, with switches for intervals, chart types and each indicator.
Hardest part
Live data had to stay cheap. A price feed can update many times a second while the chart holds thousands of candles. The chart compares the new list with the old one and recalculates only what changed, usually the last candle. Indicators update the same way.
The chart follows new candles while the latest one is in view, stays put once you scroll back, and adds older candles from onLoadMore without moving the view.